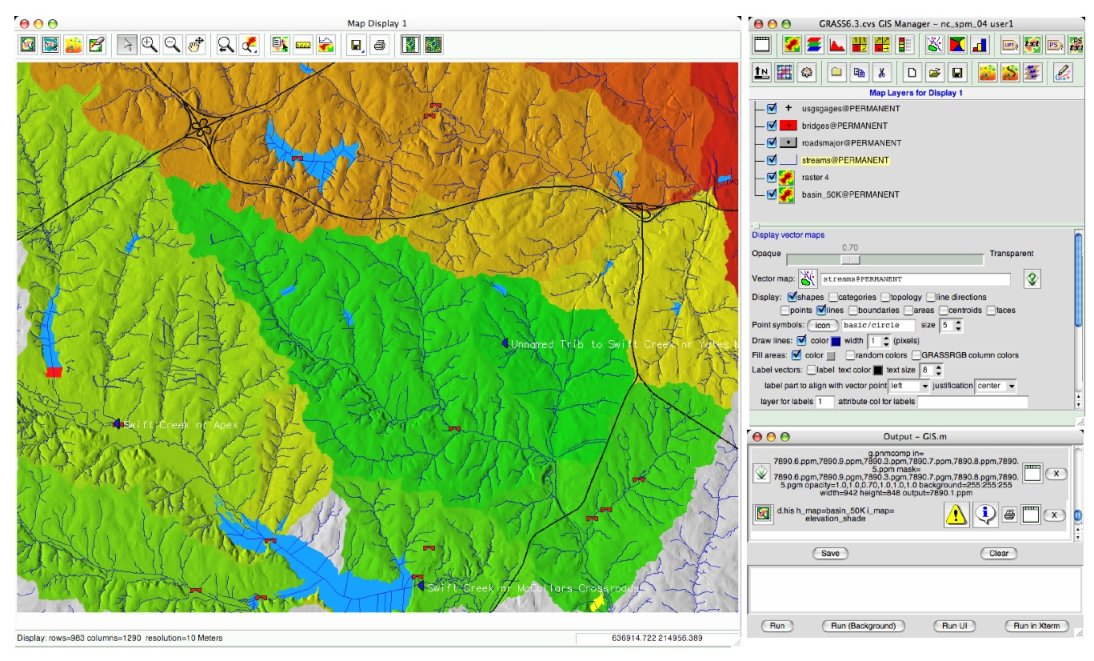
GRASS GIS manager GUI
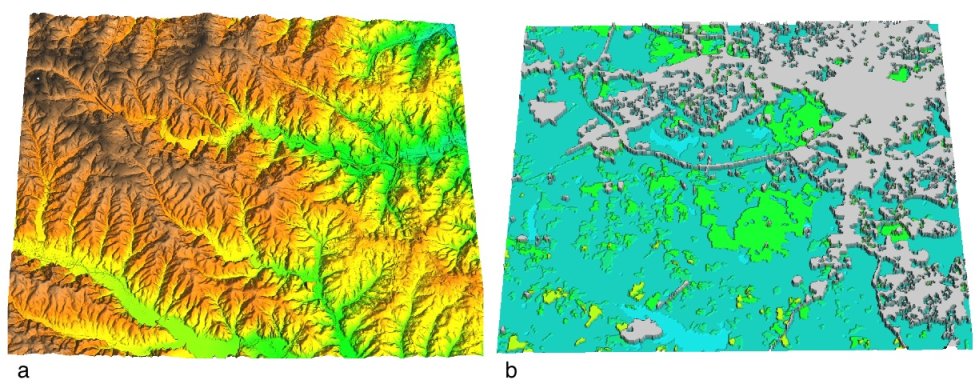
Continuous and discrete raster data
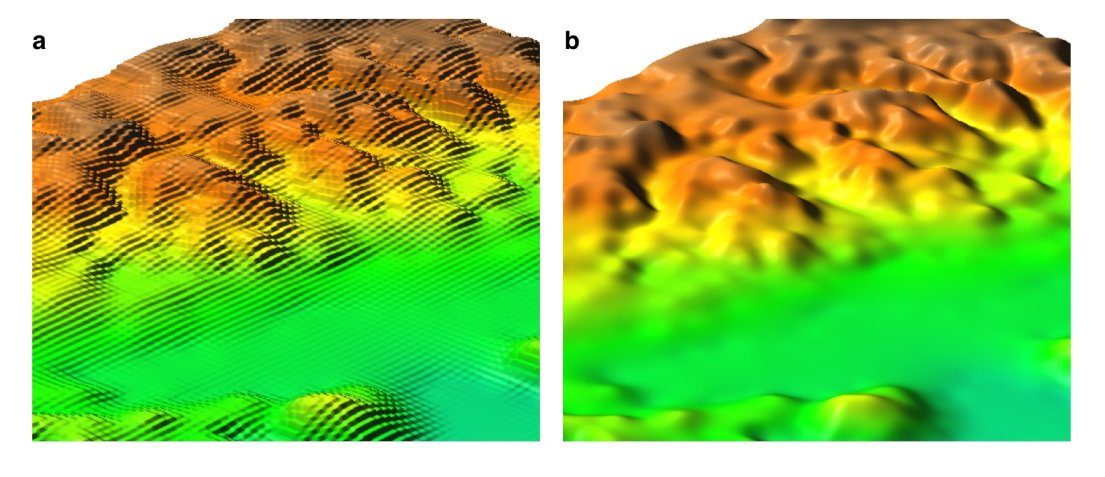
Raster resampling.jpg: nearest neighbor and spline
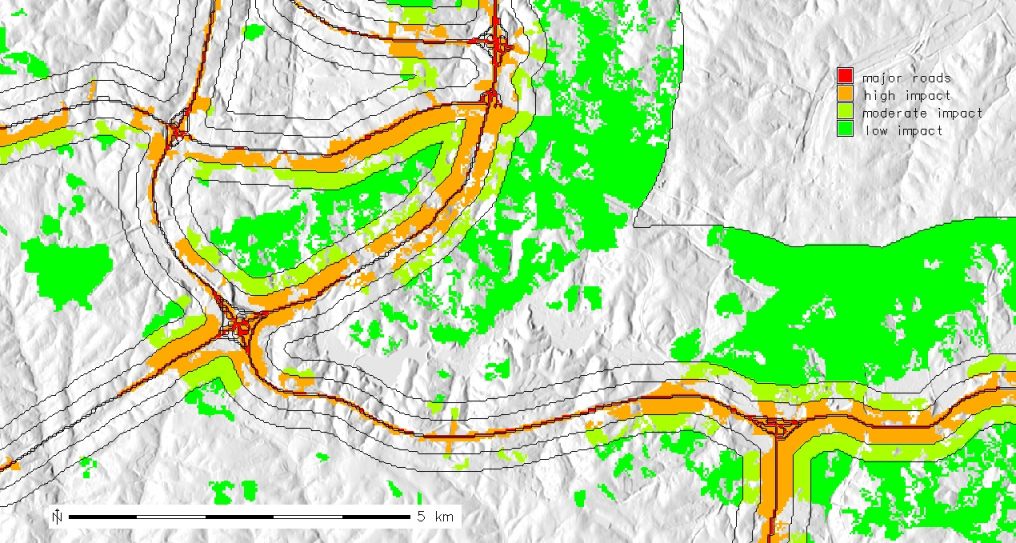
Noise impact analysis using buffers
Cost surface derived from speed limits map
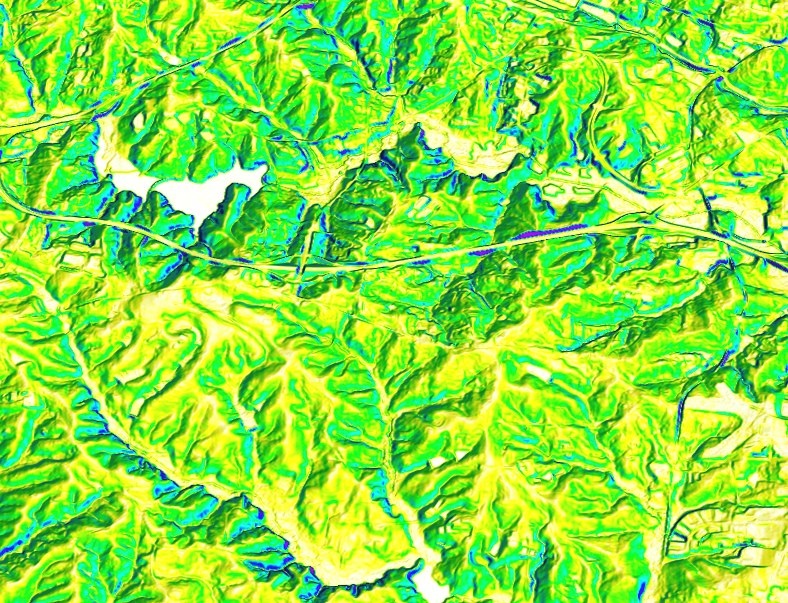
slope derived from DEM
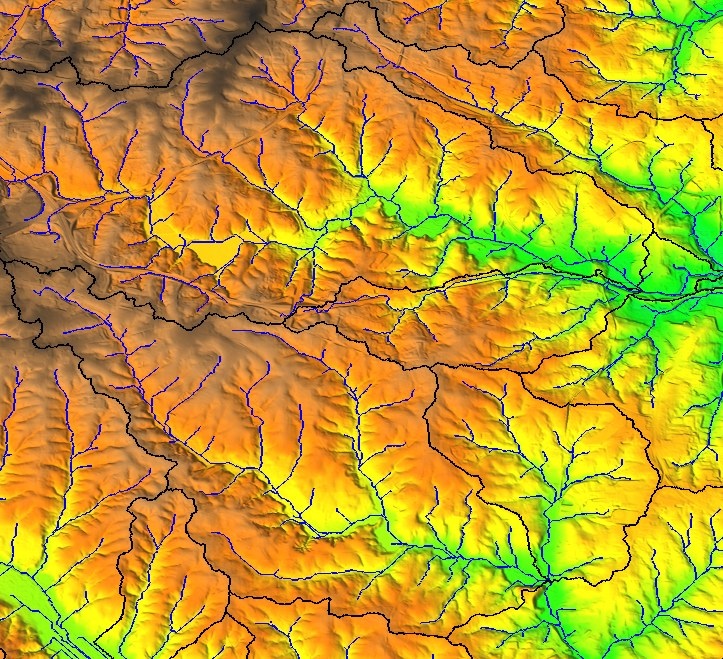
streams and watersheds derived from DEM
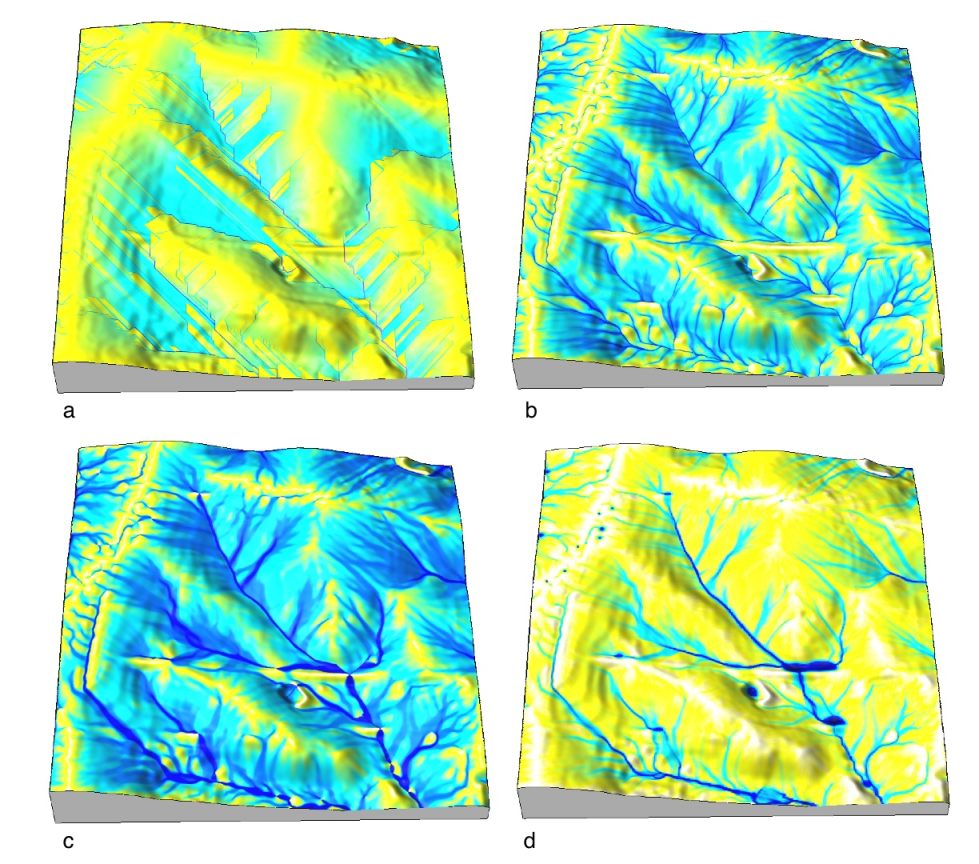
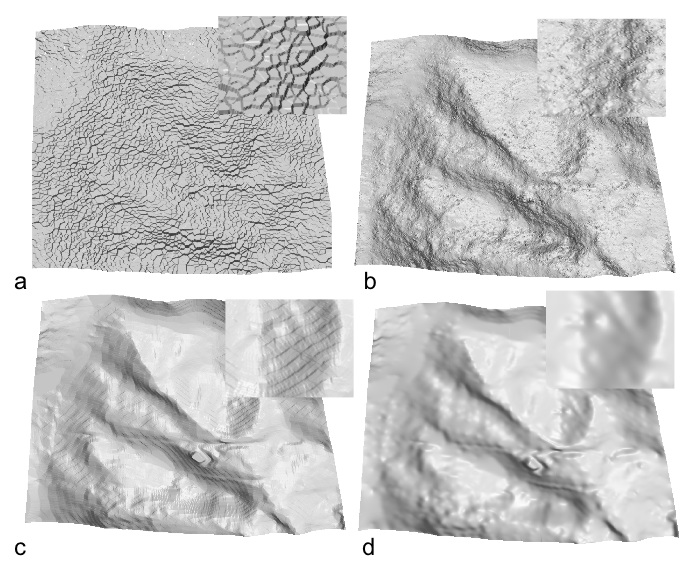
Flowaccumulation using different methods
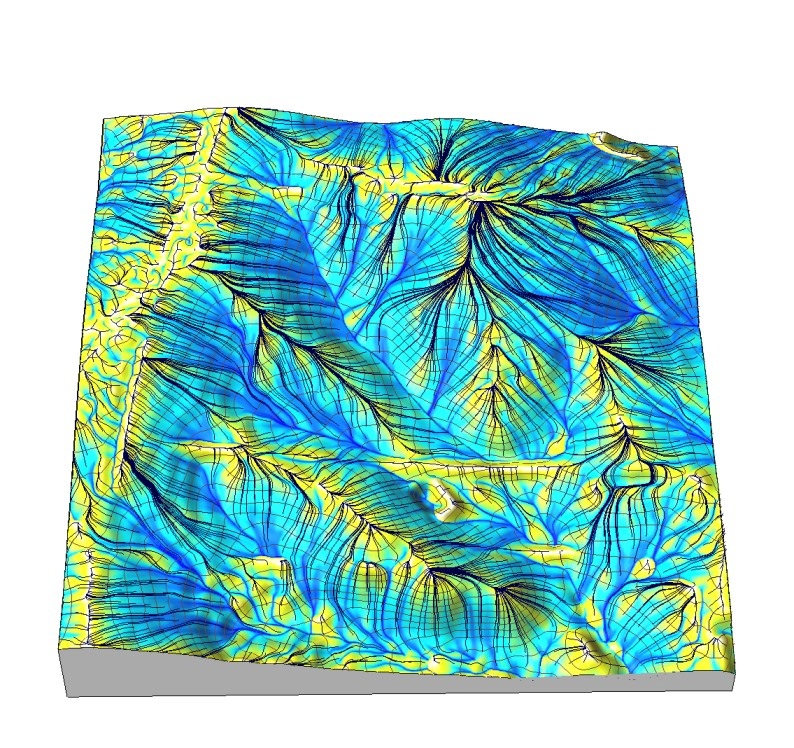
Flowaccumulation and uphill slopelines
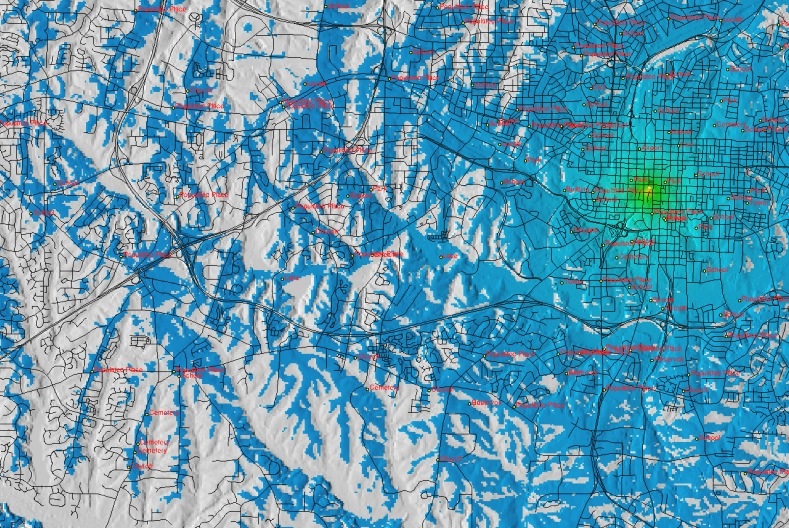
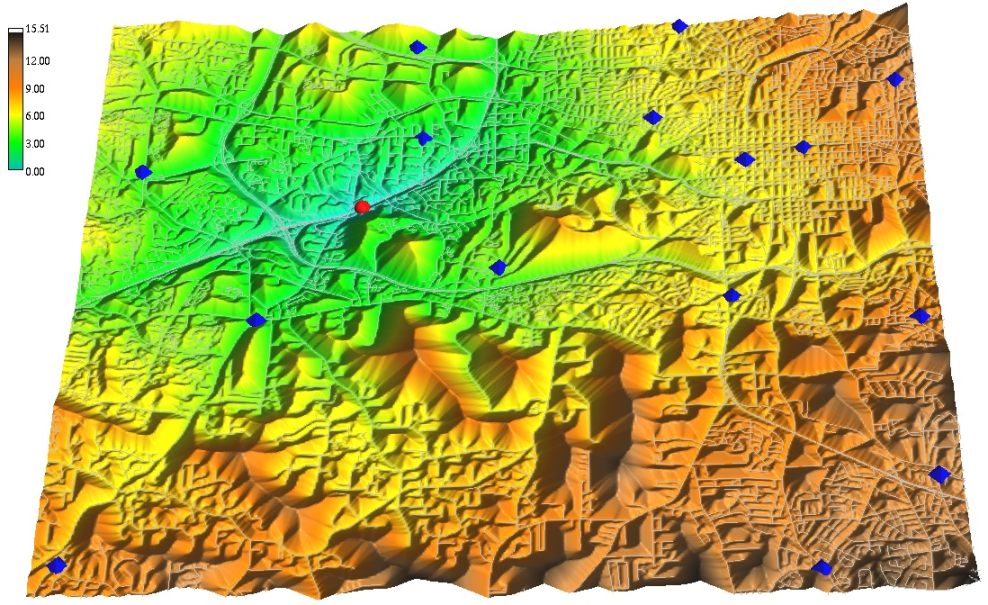
Viewshed analysis RBC tower, Raleigh
Viewshed analysis RedHat headquarters
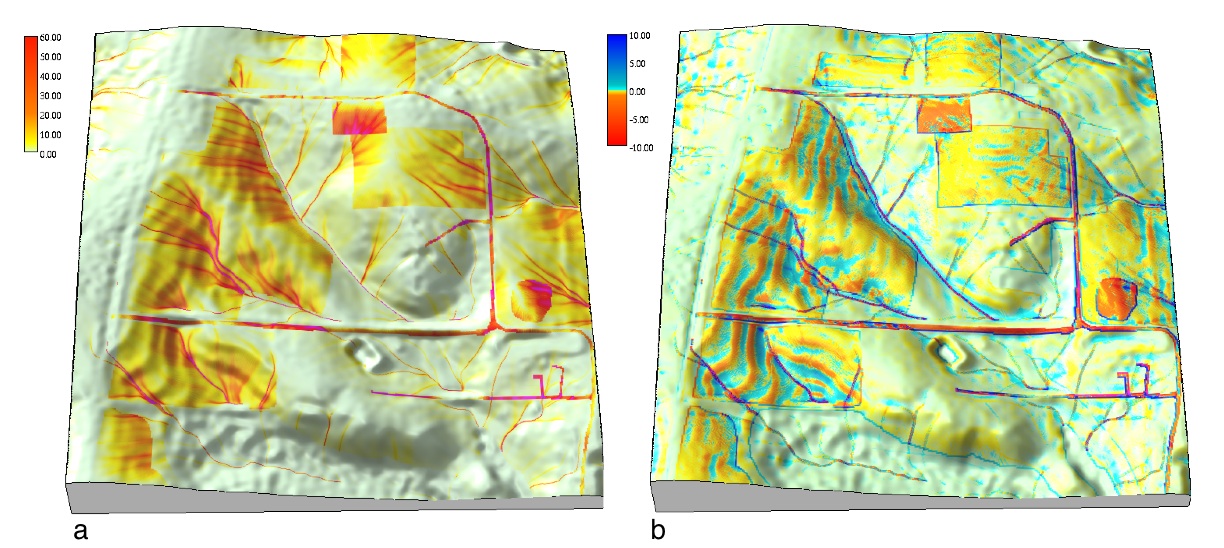
Erosion and deposition modeling
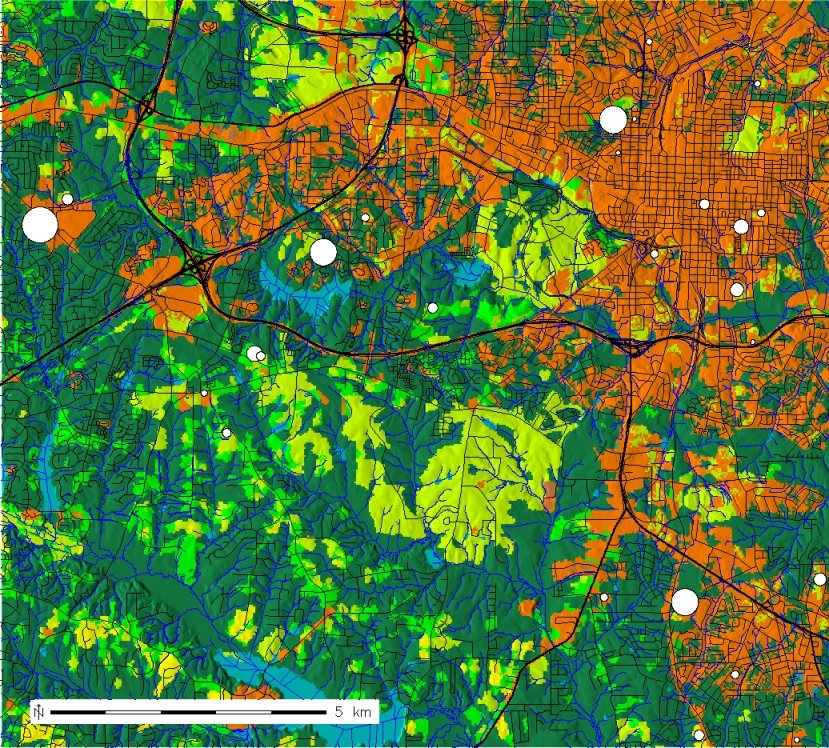
Display vector point data using graduated icon size
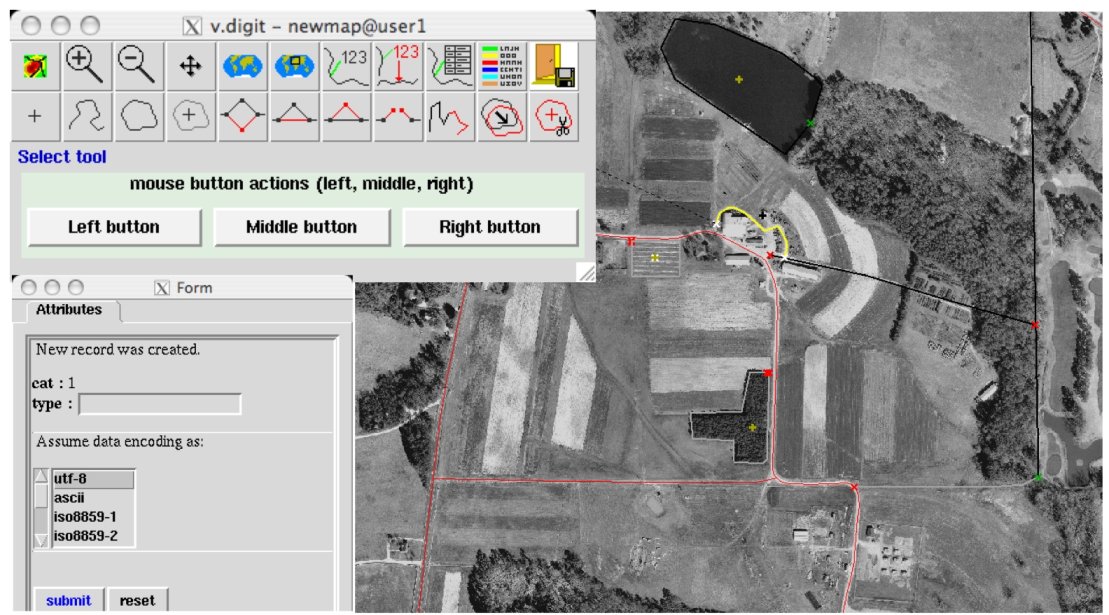
Digitizing with v.digit
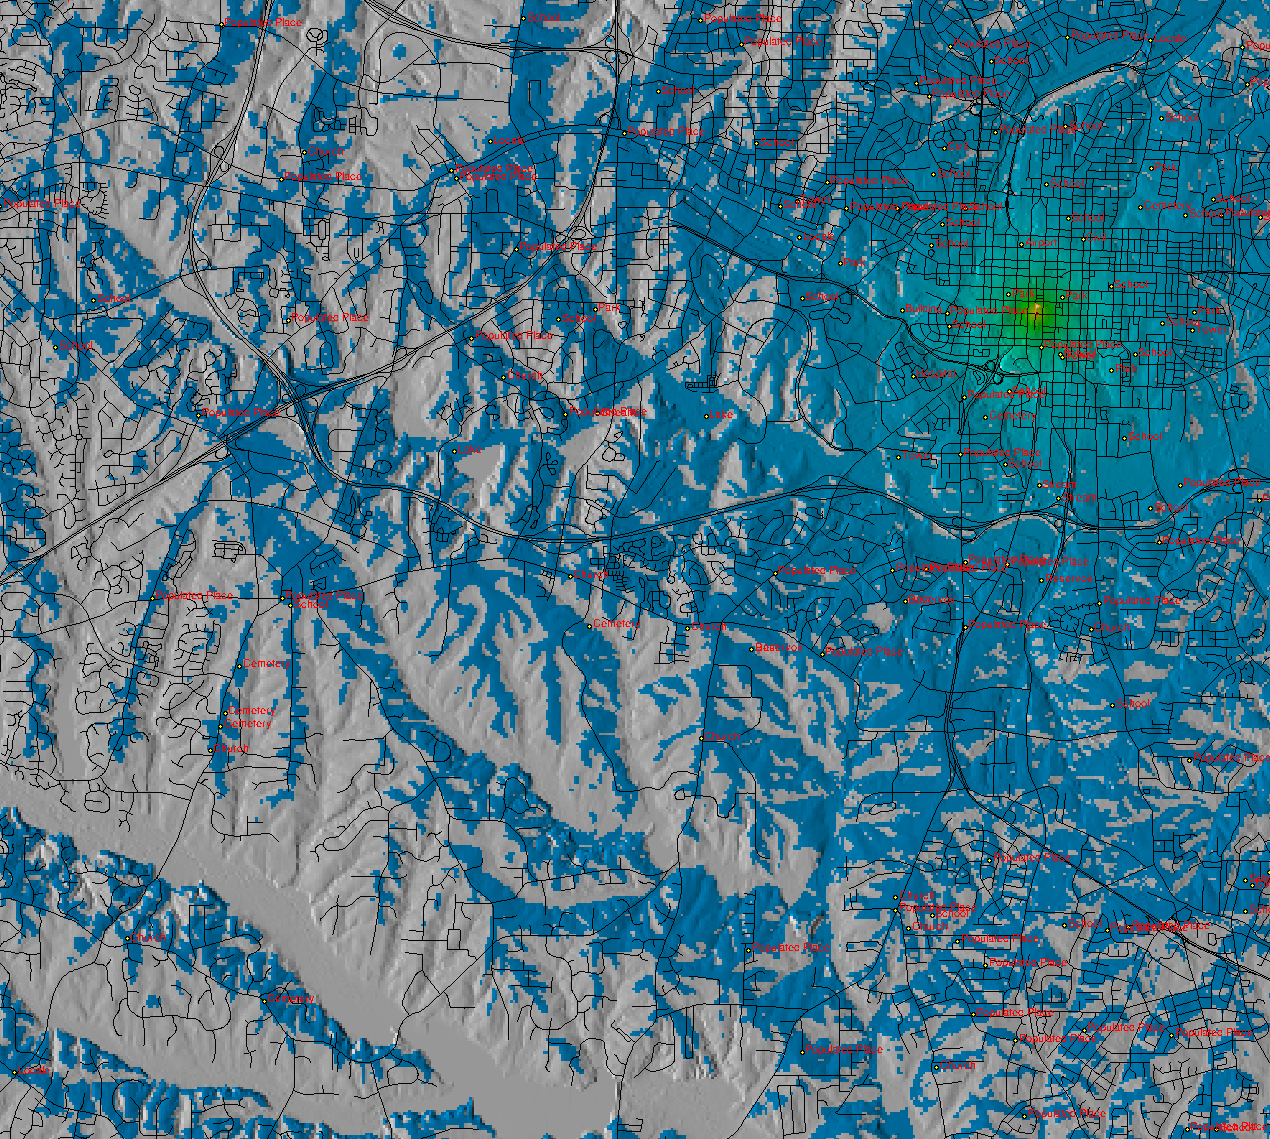
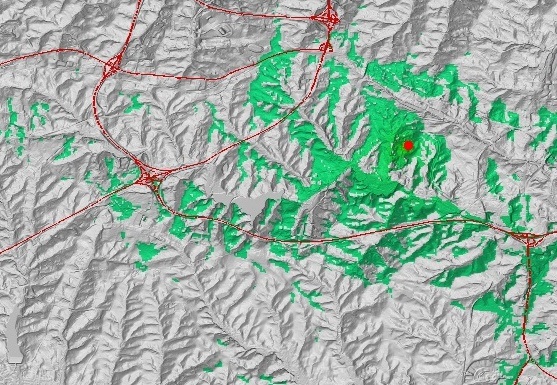
Line of sight analysis with points of interest intersected for visible area (script)

Shortest vector path from Rex to Dixon hospital (script)
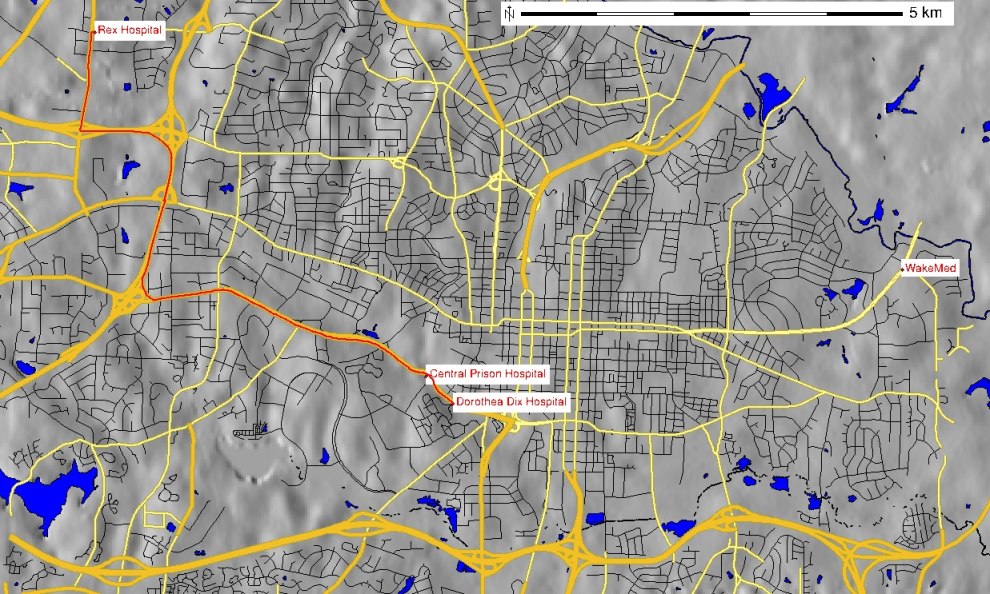
shortest path between hospitals
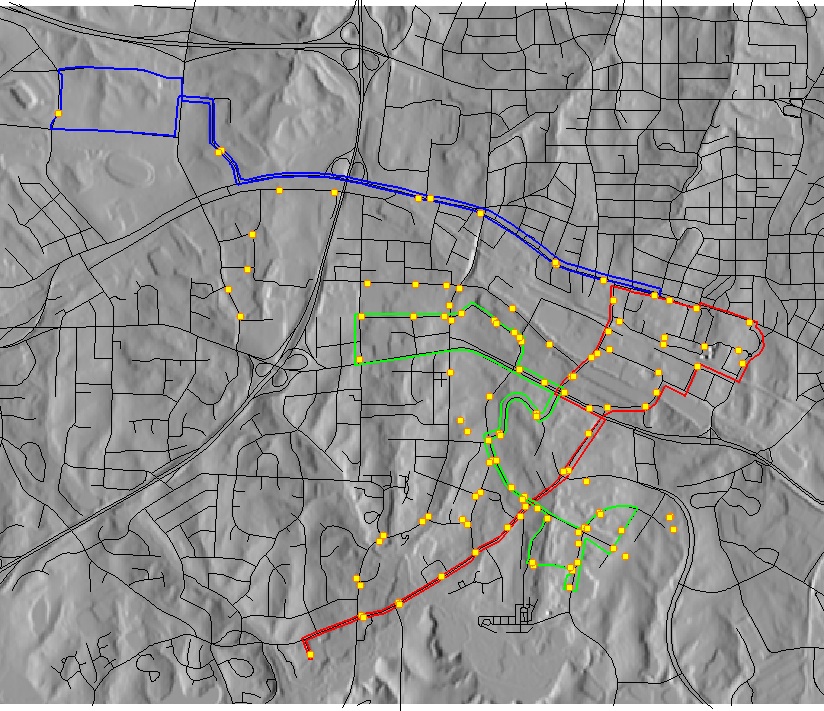
Bus lines and stops
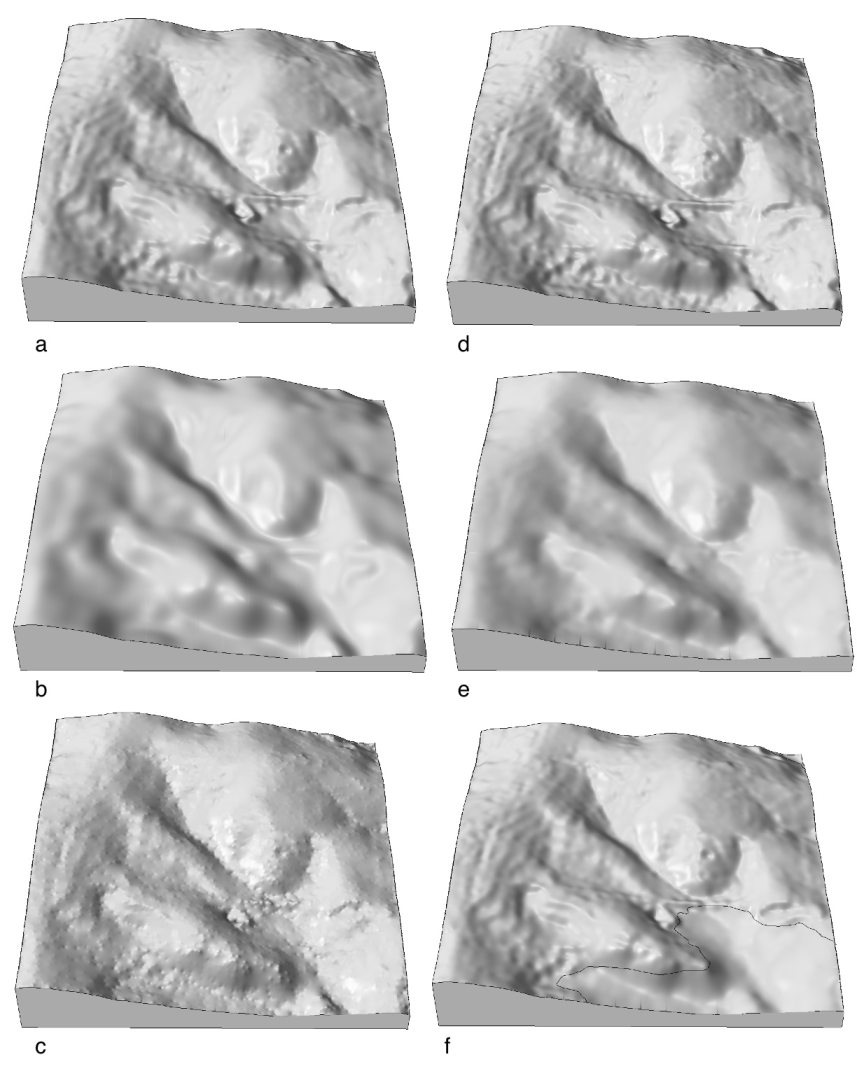
Interpolation methods
RST interpolation parameters
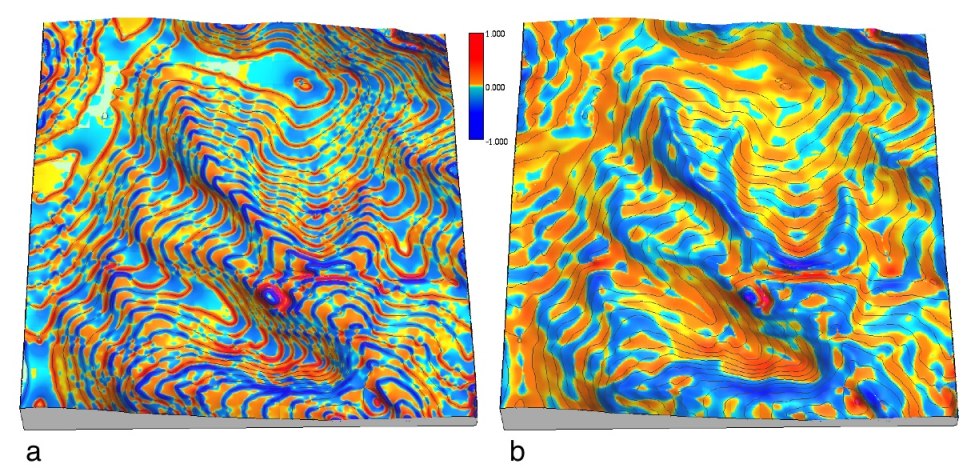
Profile curvature from contour data using v.surf.rst
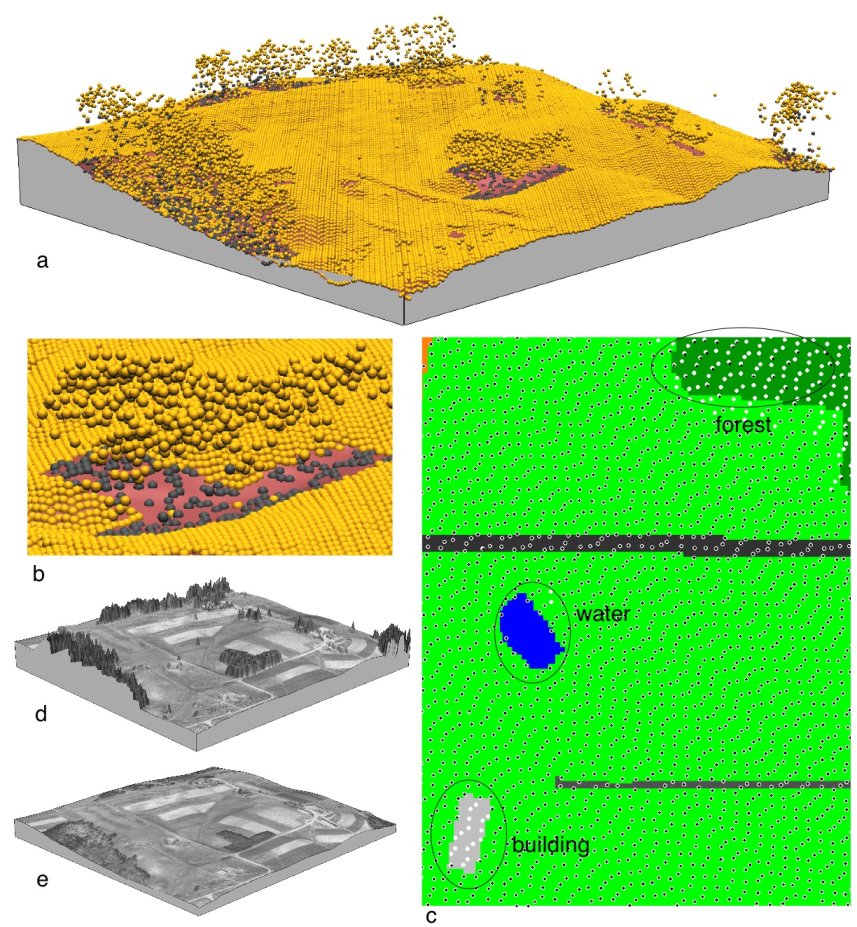
Multiple return lidar data
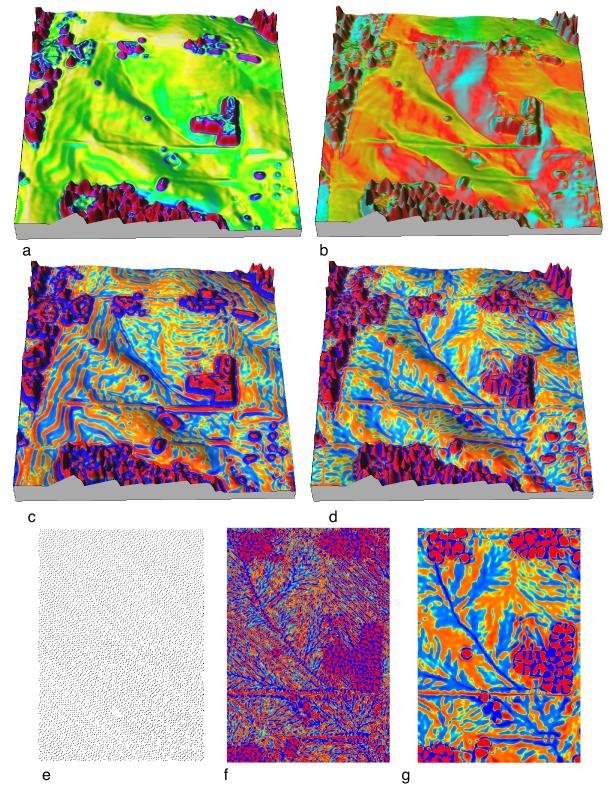
Topographic analysis from lidar data using v.surf.rst
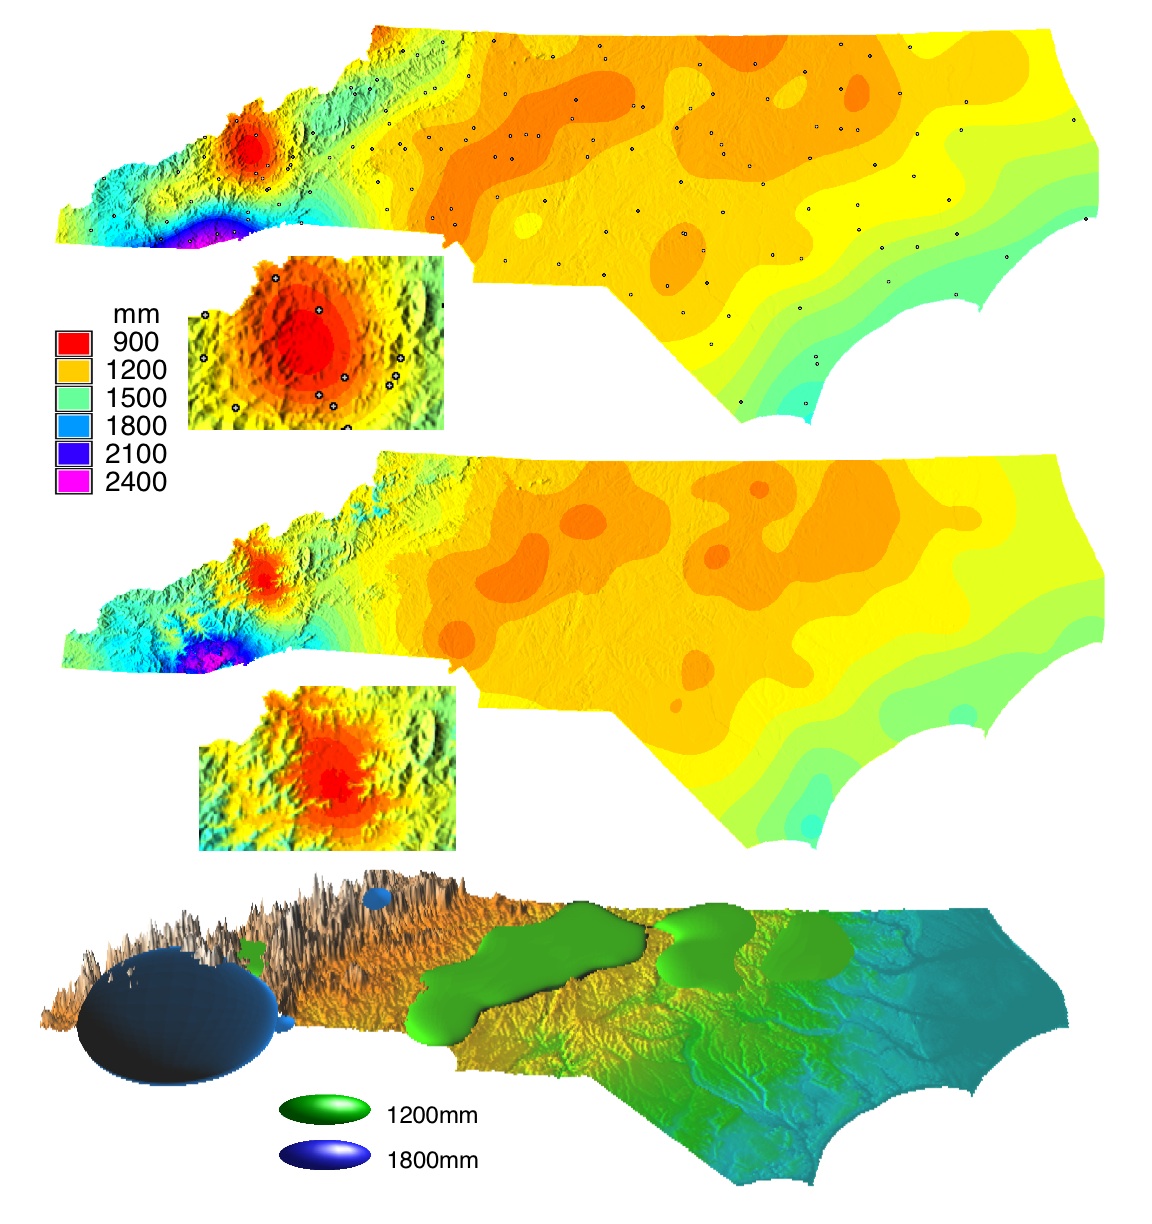
Interpolation of precipitation with influence of topography
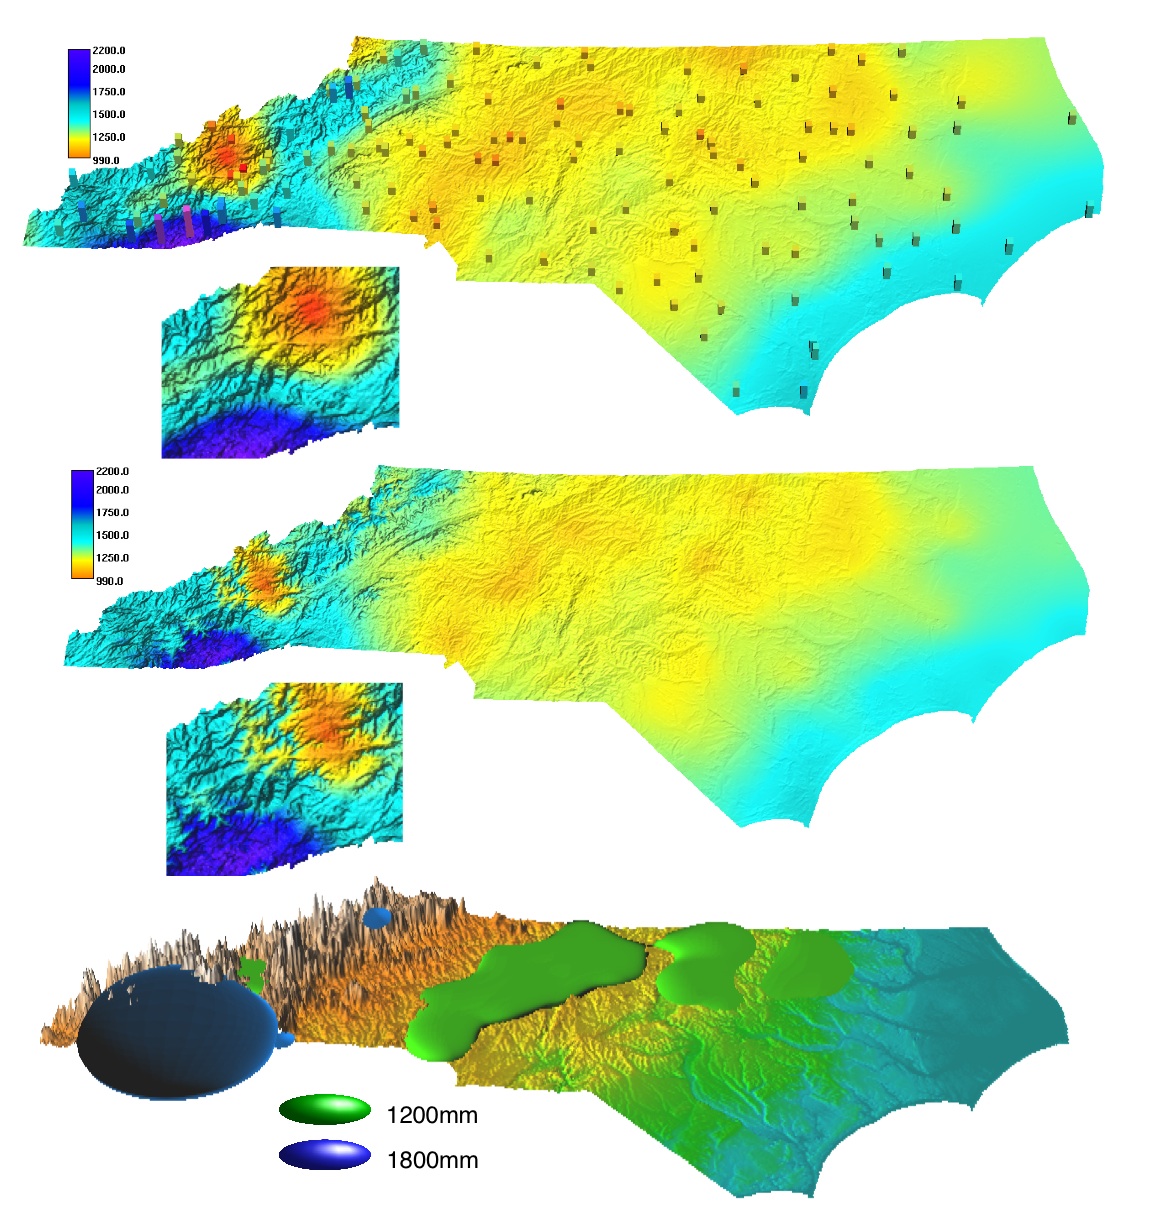
Interpolation of precipitation with influence of topography
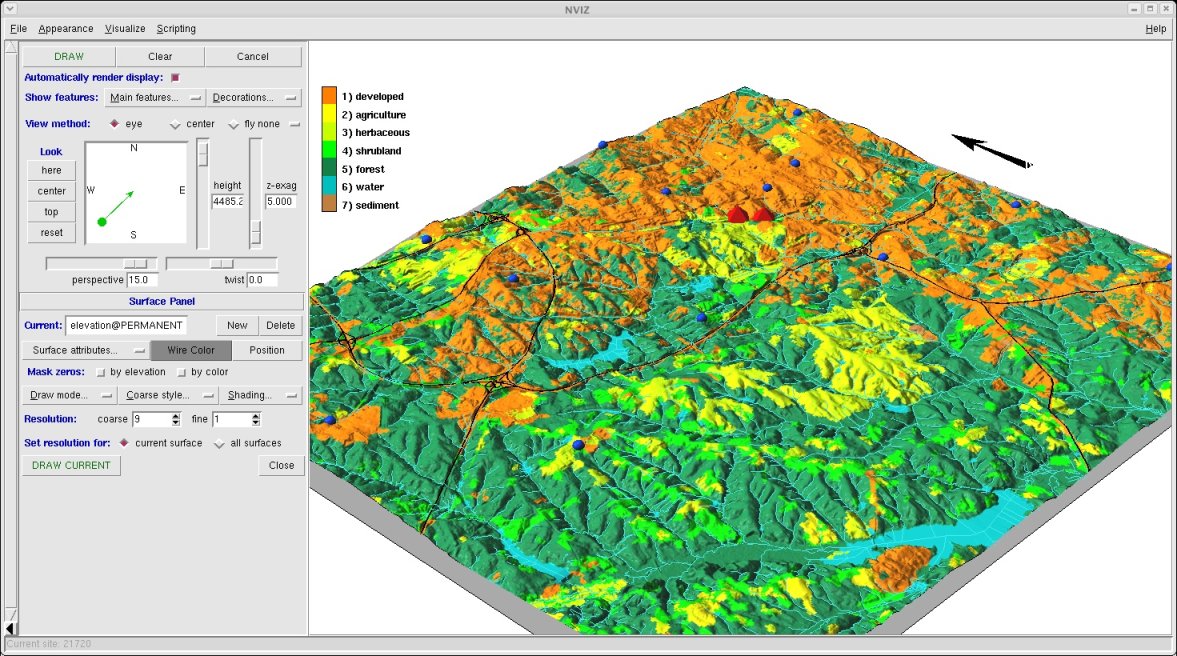
Visualizing raster and vector data in nviz
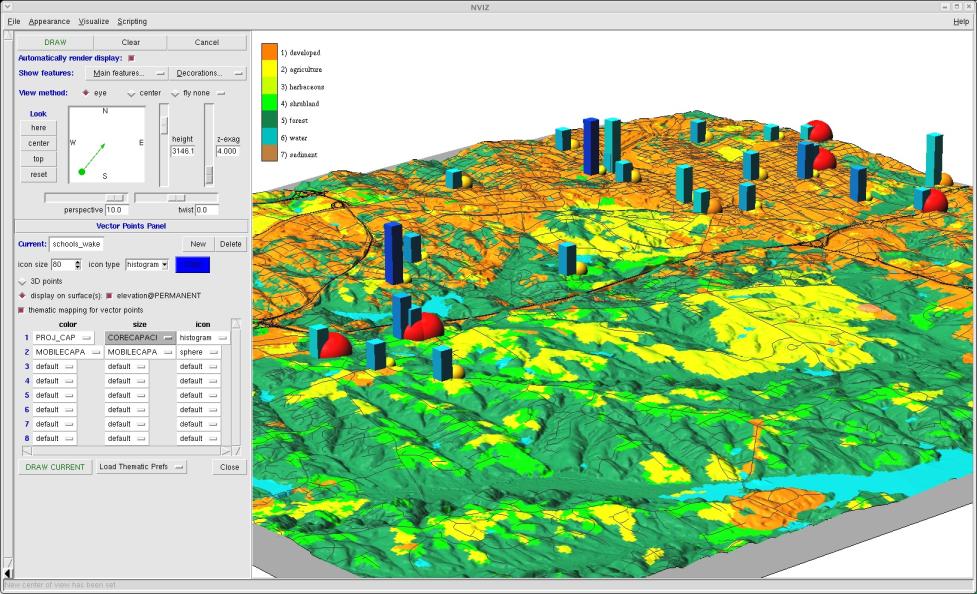
Visualizing points with multiple attributes
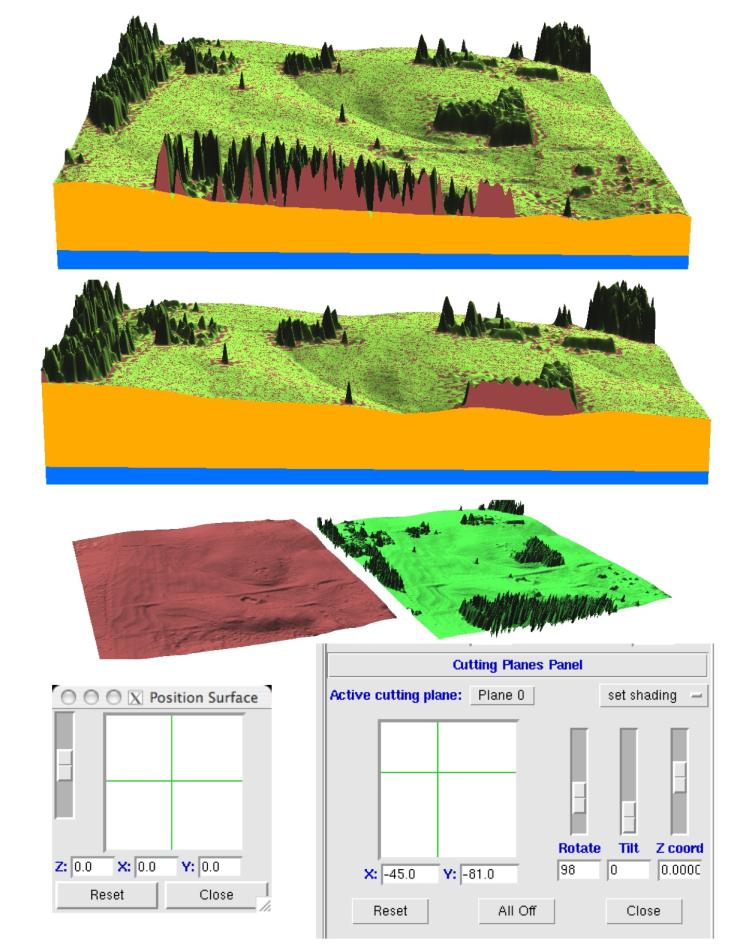
Visualizing multiple surfaces
Visualizing volumes
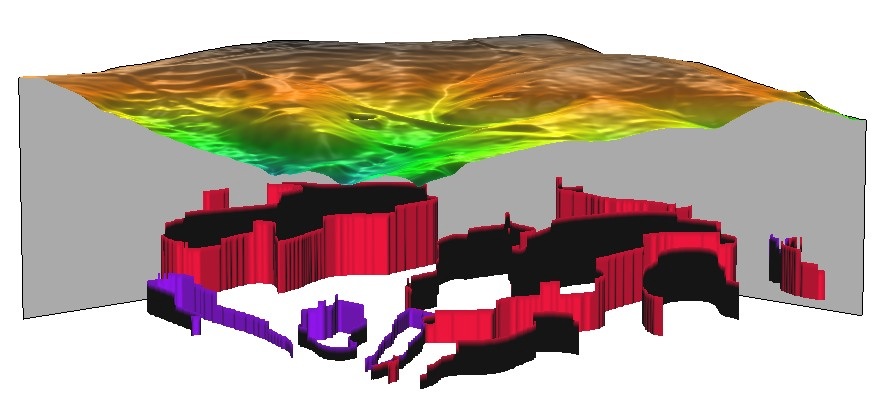
Visualizing volumes
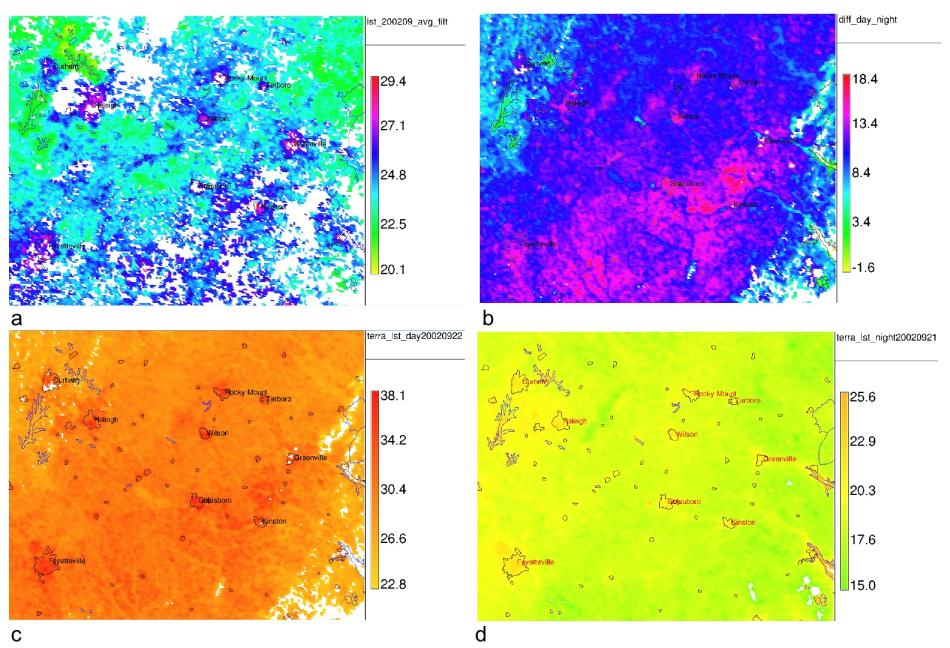
MODIS-derived Land surface temperatures (LST)
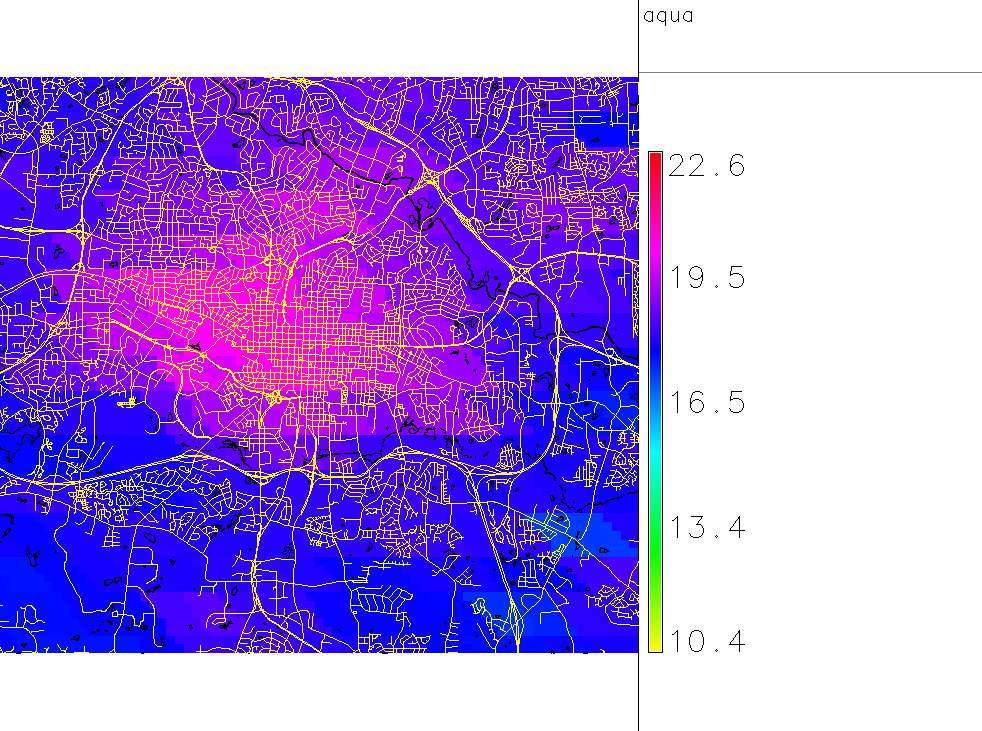
Raleigh land surface temperatures from MODIS (deg. Celsius, 25 Nov 2006, 13h30 local time)
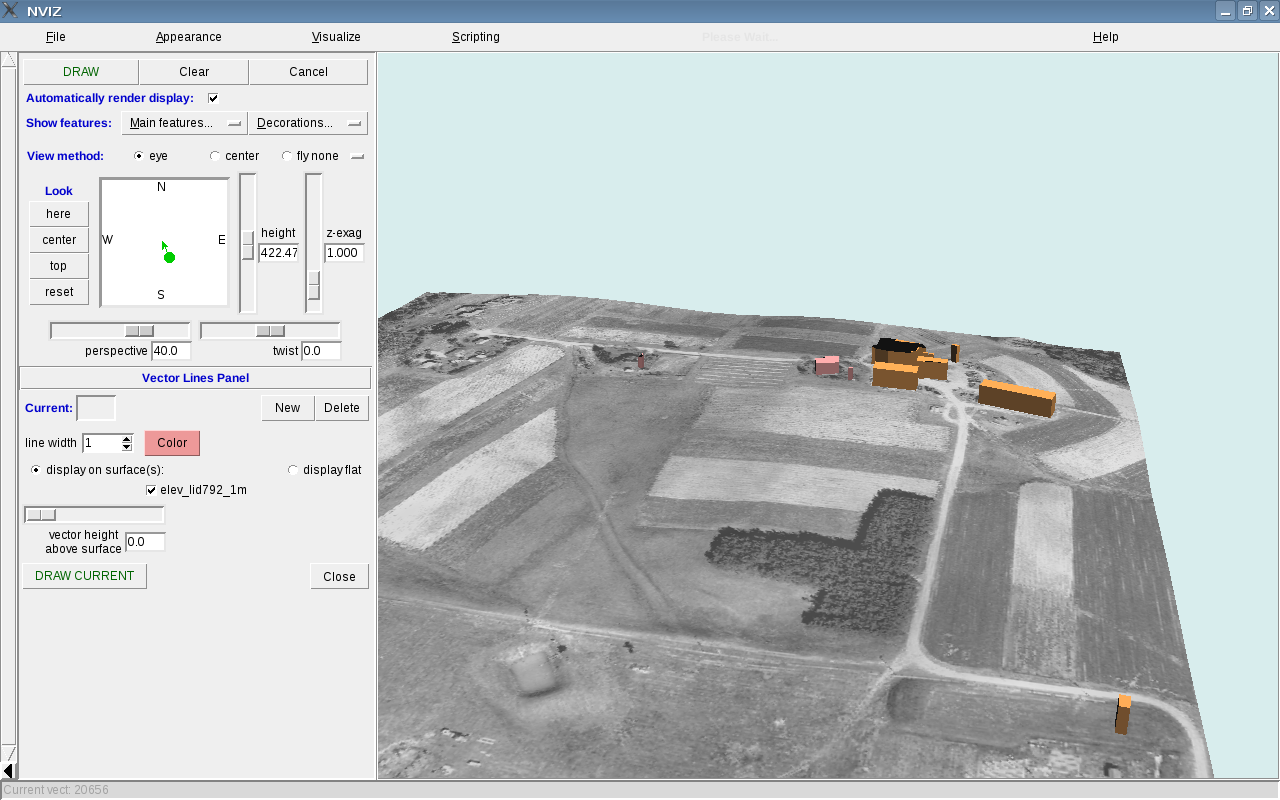
Commercial and residential buildings extruded from 2D DXF file